
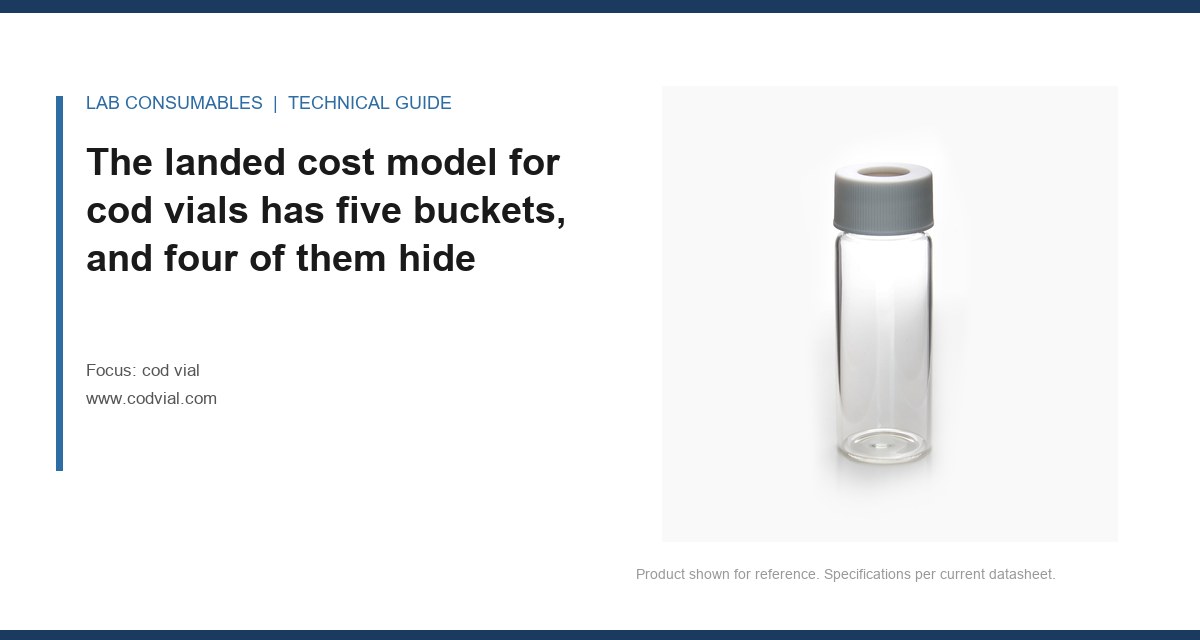
Last quarter a municipal lab in Ohio paid $0.38 per cod vial on a 5,000-unit line item. Their actual cost per usable vial came out to $0.51, and that was before the failed run. The gap was not in the invoice. It was in freight surcharges, a duty classification error, two inspection rejections, and a storage decision that baked half the lot at 54°C for six weeks. If you are doing a cod vial landed cost calculation for procurement, the unit price is the smallest variable you control.
Most buyers run a simple formula: unit price plus freight, divided by quantity. That gives you a number you can type into an ERP system. It does not give you a number you can defend in a budget review. A real landed cost model for cod vials has five buckets: freight and logistics, duty and customs, incoming inspection, storage and shelf-life degradation, and failure cost. The first two are visible on paperwork. The last three are invisible until they hit you in a method validation or a compliance audit.
I have run the numbers on cod vials sourced from three countries across two continents. The spread between the best and worst landed cost per usable unit is routinely 40 to 60 percent, even when the quoted unit prices are within 5 percent of each other. The reason is that cod vials are a dimensional and material-critical component. They are not a commodity like a pipette tip where a visual check tells you most of what you need to know. A cod vial that looks fine can fail under a 2 mL reagent load at 150°C, and you will not know until the method QC flags it.
Freight is not a line item, it is a dimensional weight problem
Cod vials ship in nested trays, usually 100 per tray, 10 trays per carton. A standard 16 mm OD cod vial with a 20 mm closure height has a packed density that is worse than you expect. The carton is mostly air because the vials cannot touch each other. Glass-on-glass contact during transit creates micro-fractures at the neck, and those fractures become stress risers during thermal cycling. Manufacturers that do not use full tray inserts are shipping you pre-damaged product.
The freight calculation that matters is chargeable weight, not actual weight. A 5,000-unit cod vial shipment in standard tray packaging occupies roughly 0.35 cubic meters and weighs about 42 kg. At a typical air freight rate of $4.80 per chargeable kg with a 1:6 volumetric ratio, that carton bills as 58 chargeable kg. That is $278 in freight. If you switch to a supplier using denser tray nesting with the same vial dimensions, the cube drops to 0.22 cubic meters and the freight line drops to $174. The unit price difference between those two suppliers might be $0.02. The freight difference is $0.021 per vial. Freight just ate the entire price advantage.
For ocean freight, the math shifts but does not disappear. A 20-foot container holds roughly 1.2 million cod vials in standard tray packaging. Ocean freight from Shanghai to a U.S. East Coast port runs $3,800 to $5,200 depending on season. That is only $0.003 to $0.004 per vial. But ocean freight adds 28 to 35 days of transit time, and cod vials sitting in a container at 40°C for a month are not the same product that left the factory. The closure liner, usually PTFE-faced silicone, begins to compression-set under sustained heat. We will get to that in the storage section.
Duty classification errors are common and they compound across the year
Cod vials fall under the U.S. Harmonized Tariff Schedule heading 7017.20, laboratory glassware. The duty rate is 4.9 percent for most countries of origin, but it drops to zero for certain free trade agreement partners with proper documentation. The problem is that many customs brokers classify cod vials under 7010.90, which covers general-purpose glass containers. That heading carries a different rate and, more importantly, triggers different documentation requirements under EPA import rules for laboratory glassware.
I have seen a single misclassification on a $12,000 cod vial import add $588 in duty and then trigger a customs hold that added 11 days of demurrage at $85 per day. That is $1,523 in avoidable cost on a shipment where the buyer thought they had saved $400 by choosing a cheaper broker. The duty line in a cod vial landed cost calculation should include the broker fee, the actual duty paid, and a small reserve for classification risk. I use 6.5 percent of invoice value as a planning figure for duty plus brokerage on cod vial imports from non-FTA countries. That covers the 4.9 percent duty, the broker fee, and the occasional customs exam.
If you are importing from a country with a free trade agreement, do not assume the zero rate applies. The certificate of origin must list the specific HS code and the specific product description. A generic certificate that says “laboratory glassware” will be rejected. The supplier needs to state “COD digestion vials, borosilicate glass, 16 mm OD, with PTFE-lined screw cap” on the certificate. That level of specificity is what customs actually checks.
Incoming inspection is where the unit price stops being the unit price
You cannot skip incoming inspection on cod vials. Not if you are running EPA 410.4, EPA 522, or any method where a leached contaminant or a dimensional mismatch invalidates the run. The question is what you inspect and how much it costs per lot.
A practical incoming inspection protocol for cod vials has four stations:
- Dimensional check: OD at the body, OD at the neck, wall thickness at three points, and closure thread engagement. Use a calibrated caliper and a go/no-go thread gauge. Sample size: 32 vials per lot per ANSI/ASQ Z1.4, General Inspection Level II, single sampling plan. Time: 45 minutes for a trained technician.
- Closure torque test: Apply a sealing torque of 18 to 22 inch-pounds and check for liner compression. A proper PTFE-faced silicone liner should show uniform compression at 20 inch-pounds without tearing. Sample size: 20 closures. Time: 30 minutes.
- Thermal shock test: Heat 10 vials to 150°C for 60 minutes, then transfer to a 20°C water bath. Any vial that cracks or develops visible stress lines fails the lot. Time: 90 minutes including heating.
- Leachables screen: Fill 5 vials with 2 mL of 0.1 N sulfuric acid, cap, heat to 150°C for 2 hours, then run the digestate on an ICP-MS for silicon, boron, sodium, and aluminum. Time: 4 hours including instrument run.
The fully loaded cost of that inspection protocol is about $185 per lot in technician time, consumables, and instrument time. On a 5,000-vial lot, that is $0.037 per vial. On a 500-vial lot, it is $0.37 per vial. That is why minimum order quantity matters more than most buyers realize. A 500-vial order at $0.35 per vial has a landed cost of $0.72 per vial after inspection. A 5,000-vial order at $0.40 per vial has a landed cost of $0.44 per vial after inspection. The bigger order is cheaper per usable unit even though the unit price is higher.
Every failed inspection adds a second cost: the replacement cycle. When a lot fails dimensional check, you do not just reject it. You wait for the replacement shipment, and that wait is usually 3 to 6 weeks for a non-stocked cod vial. If your lab runs 40 COD tests per week, a 4-week gap means 160 tests are delayed or outsourced. Outsourced COD testing runs $25 to $45 per sample. That is $4,000 to $7,200 in outsourcing cost, all because a supplier shipped vials with a wall thickness variance of 0.15 mm.
Storage is a chemical process, not a warehouse problem
Cod vials degrade in storage. The degradation is slow, predictable, and almost never tracked. The two mechanisms are liner compression set and glass surface hydration.
PTFE-faced silicone liners are rated for a service temperature range of -60°C to 230°C, but that rating is for the PTFE face, not the silicone backing. Silicone compression set accelerates above 40°C. A cod vial stored at 50°C for 90 days will show liner compression set of 12 to 18 percent. At 25°C, the same 90 days produces less than 2 percent set. A liner with 15 percent compression set does not rebound fully when the cap is torqued. The result is a seal that passes a visual check but leaks at 150°C under the vapor pressure of the digestion reagents. I have traced three failed COD runs back to liners that were stored in a warehouse without climate control during a Texas summer.
Glass surface hydration is slower but more insidious. Borosilicate glass absorbs moisture from humid air at a rate that depends on relative humidity and time. At 60 percent RH and 25°C, the surface hydration layer grows by roughly 0.5 nanometers per month. That does not sound like much, but a 10 nm hydration layer is enough to change the surface energy and affect how the digestion reagents wet the vial wall. For COD methods that rely on complete oxidation, a partially hydrated surface can leave a residue film that shifts the dichromate reduction measurement by 2 to 4 percent.
The storage rule I use: cod vials should be stored at 15 to 25°C with relative humidity below 50 percent, in original sealed packaging, and used within 18 months of the date of manufacture. If your supplier does not print a manufacture date on the carton, ask for it. If they cannot provide it, assume the vials are at least 6 months old when they arrive. That assumption changes your shelf-life math and your reorder point.
Failure cost is the bucket that turns a $0.03 saving into a $30,000 loss
Every cod vial landed cost calculation that ignores failure cost is not a cost calculation. It is a price comparison with extra steps. Failure cost is the expected value of a vial that passes incoming inspection but fails during use. The failure modes are specific and measurable:
- Closure leak during digestion: The vial loses reagent volume at 150°C, which changes the sample-to-reagent ratio and invalidates the COD result. Frequency in a good lot: 0.2 to 0.5 percent. Frequency in a marginal lot: 2 to 4 percent.
- Glass fracture during thermal cycling: The vial cracks when moved from a 150°C digestion block to a room-temperature rack. Frequency in a good lot: 0.1 percent. Frequency in a lot with wall thickness variance: 1 to 3 percent.
- Liner delamination: The PTFE face separates from the silicone backing under repeated heating cycles. Frequency in a good lot: 0.05 percent. Frequency in a lot stored hot: 5 to 8 percent.
- Leachable contamination: The glass or liner releases a compound that interferes with the spectrophotometric measurement. Frequency in a good lot: 0.1 percent. Frequency in a lot from a supplier that changed glass formulation without notice: 10 to 20 percent.
The cost of a single failed COD test is not the cost of the vial. It is the cost of the technician time to re-run the sample, the cost of the reagents, the cost of the instrument time, and the cost of the delay in reporting. In a typical municipal lab, a re-run costs $18 to $35 in direct costs and adds 2 hours to the sample turnaround. If the failure is not caught by the method QC and the result is reported, the cost jumps to a compliance violation, a resampling event, and potentially a notice of violation.
Here is the worked example that turns a unit price into a cost per usable unit:
| Cost element | Supplier A | Supplier B |
|---|---|---|
| Unit price (per vial) | $0.38 | $0.42 |
| Freight (per vial, air, 5,000 units) | $0.056 | $0.035 |
| Duty and brokerage (per vial, 6.5% of invoice) | $0.025 | $0.027 |
| Incoming inspection (per vial, $185 per lot) | $0.037 | $0.028 |
| Storage loss (per vial, 18-month shelf life, 2% write-off) | $0.008 | $0.008 |
| Failure cost (per vial, expected failure rate × re-run cost) | $0.063 | $0.014 |
| Landed cost per usable vial | $0.569 | $0.532 |
Supplier A has the lower unit price by $0.04. Supplier B has the lower landed cost by $0.037 per vial. On a 5,000-vial annual purchase, Supplier B saves $185. On a 50,000-vial annual purchase across multiple lab sites, Supplier B saves $1,850. The failure cost line is the swing factor. Supplier A has a 2.5 percent expected failure rate. Supplier B has a 0.5 percent rate. The difference is not visible on the quote. It is visible in the supplier’s process control data, their incoming inspection records, and their willingness to share dimensional and leachables data.
Two field cases that show where the money actually goes
A contract lab in New Jersey switched cod vial suppliers to save $0.06 per vial on a 20,000-vial annual buy. The new supplier quoted a competitive unit price and a 10-day lead time. The first shipment arrived with 4,000 vials packed in bulk trays without individual cell separation. Incoming inspection found 11 percent of the vials with visible neck scratches. The lab accepted the lot after culling the scratched vials, which took 6 technician hours. Three weeks later, the lab ran a batch of 60 COD samples and had 7 failures: 4 closure leaks and 3 glass fractures during thermal cycling. The failure rate was 11.7 percent on that batch. The lab re-ran the 7 samples, spent $210 on re-runs, and then pulled the remaining vials from that lot. The total cost of the supplier switch was $1,860 in direct costs plus the loss of a client that received late results. The $0.06 per vial saving on 20,000 vials was $1,200. The switch cost more than it saved.
A wastewater treatment plant in Colorado ran a cod vial landed cost calculation after noticing that their COD reagent costs were rising. They had been buying vials from a distributor at $0.45 per vial with no inspection protocol. A new lab manager implemented the four-station incoming inspection described above. The first lot from the distributor failed the thermal shock test: 3 of 10 vials cracked. The lab rejected the lot and switched to a supplier that provided dimensional data and a certificate of analysis with each shipment. The new supplier’s unit price was $0.52, but the failure rate dropped from an estimated 3 percent to under 0.5 percent. The lab’s annual COD re-run count dropped from 41 to 7. At $28 per re-run, that is $952 in direct savings. The landed cost per usable vial dropped from $0.61 to $0.55, even though the unit price went up by $0.07.
The decision rule for cod vial procurement
Run the five-bucket landed cost model on every supplier quote. Use your own failure rate data, not the supplier’s marketing claims. If you do not have failure rate data, start collecting it now: log every failed COD run, note the vial lot number, and compute the failure rate by lot. A supplier that cannot provide lot-level traceability is a supplier that is hiding a failure cost you will pay later. The unit price is the number on the quote. The landed cost per usable vial is the number that shows up on your lab’s P&L. Buy the second number.
For cod vials, the suppliers worth working with are the ones that publish dimensional tolerances, provide a certificate of analysis with each lot, and package vials in individual cells with full tray inserts. That is the baseline. Everything else is a risk you are paying for in the failure bucket. If you are sourcing cod vials, start with the product range at Cod Vial, and check the dimensional compatibility against your digestion block before you commit to a volume. The vial insert geometry matters when you are running micro-volume methods, and the 2 mL vial format is the standard for autosampler compatibility. For the broader chromatography consumables picture, HPLC consumables selection affects your method reproducibility downstream. The reference methods that drive COD testing are in U.S. EPA SW-846, and the instrument compatibility data is available from Agilent, Thermo Fisher, and Restek. The cost model does not change when you move between suppliers. The failure rate does.
References & further reading
Related resources from our lab consumables network:
- Cod Vial at codvial.com
- Vial Insert at hplcinsert.com
- 2Ml Vial at 2mlsamplevial.com
- Hplc Consumables at hplcconsumable.com
External references and standards: